[I plan to come back and re-work this blog- give me a few days, ed.]

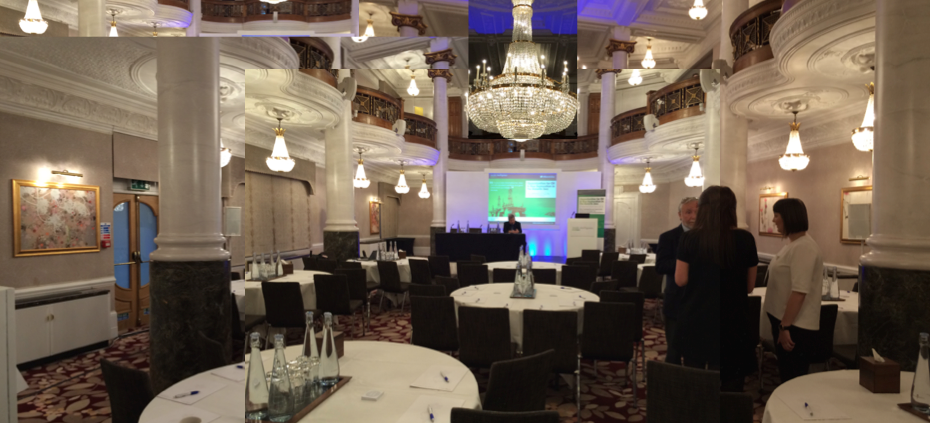
Oil and Gas Exploration in the Barents Sea, October 6-7, St. Ermin’s Hotel, Caxton Street, London, SW1H 0QW

October 7: Day Two
Chair’s Opening Remarks
Hans-Christen Rønnevik, Vice President Exploration, Lundin Norway AS
Lundin’s Story: How Do We Unfold Reality In A Mature Area? Lundin’s exploration activities based on 42 years of experience in the Barents sea; The Gohta oil discovery; The petroleum habitat of the Loppa High

Begins quite philosophically, about the role of knowledge. “Visions are achieved by action, not by thinking”. Fact and experience based operational knowledging (conceptual procedures). [I will have to return to post up some of Hans’s slides, which are made up of declarations which he states in a clear punctuated manner – mainly, modeling is not a method of thinking, but certainly a necessary skill] — continuously unfold reality as you interact with it – to explain broadband 3D for deterministic mapping as input to models. Gohta discovery in the Loppa high, 2013: recoverable resources 10-23 Sm3 oil/ 8-15 billion sm3 gas; 2014: Gohta 2 Environmental mapping in Barents Norway since 2007, working with NGU and FFI.
Key Note: Denis Francois, Geoscience Director, TOTAL E&P Norge AS and Dominique Roy, Western Europe New Ventures Manager¸ TOTAL E&P Norge AS: Weighing up economic implications of operating in the Barents Sea; Facing technological challenges – experiences from Novarg and Snøhvit; Managing operations in an unfavourable climate condition. Total/Fina/Elf – Yet to Find. West Barents 4.8 boe and East Barents NO 2 boe. Novarg – new venture stage: 2008 to license award 2009. Looking to set up an LNG ii train to Snøhvit.
Artem Rabey, Exploration Manager, LUKOIL Overseas North Shelf: Tectonic development, depositional environment and sedimentation; Analogies with Timan-Pechora basin; Hydrocarbon potential — two licenses in Norway.
Knut Gunnar Amaliksen, Senior Geophysical Advisor, Wintershall Norge: Predicting the good reservoir; The Importance of field work; Be brave and the rewards will come. Pre-Jurassic reservoirs. PL611 – Kvalross Analogue (Edgeøya, Svalbard).
Hot Topics discussion: Hans-Christian presents the problems — How do we form strategic alliances in rig sharing; should there be tax breaks in Barents Sea; Cost issue where 500 million barrels is appropriate development; Will Statoil’s step program build efficiency; Can the French take more Snøhvit gas to France; what about oil spill issues and environmental concerns; and local community impact on development in the region; Have we solved the problem of oil and gas, and can it be done without more exploration and what is the role of tax relief.
Cost issue: Terje Flaten, Statoil, takes the stage to present the issue — what kind of single oil pool accumulations can you have for commercial development given oil price scenarios and current cost regimes – I didn’t quite say 500 million barrels, could be distance to market, technics etc. e.g., Golath is 175 million barrels – Johan C. field, two accumulations, had they been in one single accumulation we would have been happier. Further into the Barents need to find +300 million barrels oil. Industry self inflicted upon itself a cost regime that 3 times larger than previously, and now the cost profile is [through the roof] – attempting to standardize at the High North – lower scale of cost, pushing back on prices for development because of differences in Barents versus North Sea (e.g., depth);
Gas strategy for transportation: ? from the back of the room — delivering gas to Western Europe is a political issue, that could create security in the region.
Environment: Stig-Morten Knutsen, talking about lenses and in-situ burning for oil spills. Several issues that need to be working as an industry as an issue. Other speakers focus effort on well-blow out prevention instead of on spill. When you talk about oil spill, its about optics. Also safeguarding — evacuation, getting people in and out — waiting for initiative to expand base on Bear Island or does the industry invest into creating better preparedness.
Rig alliances – [what can be created among oil companies and a rig fleet on continuous activities and a coordinated rationalized plan] – The longest lead item to carry this out is the Rig – “have an adult conversation about our needs and then approach the rig owners”. Looking for a group rig share for the 23rd license. Tax relief — 78% investment return.
Ove Tobias Gudmestad, Professor of Marine Technology, University of Stavanger; Emergency Operations, Evacuation And Rescue In The Barents Sea; The physical environmental conditions in the Barents Sea; Emergency and evacuation operations in the cold arctic seas; The geography of the Barents Sea and rescue operations – Arctic versus cold climate region (Barents region). Referring to Barents 2020 map created by DNV with step wise development into Barents area.
Stein Sandven, Vice Director, Nansen Environmental and Remote Sensing Centre
Breaking the Ice: Managing Operations in Icy Environments; Understanding different structures of ice and how to incorporate this knowledge into operations; Predicting and detecting ice to optimise exploration operations; Identifying technology to ease operations in ice; Learning from past operations in remote, ice ridden regions: case study of other Arctic regions — How do we predict and how do we detect.

October 6: Day One
Chair’s Opening Remarks
Hans-Christen Rønnevik, Vice President Exploration, Lundin Norway AS
8:58AM – Just getting started here – a hush has taken over the group of about 50 industry players and now it looks like Anna Townsend, Program Manager, is going to get us started with a quick announcement, including a welcome to Dolphin Physical, a company sponsor, and a few Russian presentations were cancelled because of visa issues, and a few other persons who may or may not be coming, and now Hans-Christen.
“Welcome to a Norwegian conference, the same hotel where Philby delivered his secrets to Russian agents, and here we are years later and with the same situation with Russians not able to obtain visas”.
Tax relief giving a new life to the Norwegian Continental Shelf (NCS). More diversity and many more companies now involved in NCS development. Amended tax regime as on the UK shelf in the 1980s led to more players. Barents opening began in the 1960s with hypothesis looking for inverted Volgian highs.
Latest – Active concession policy and new players from 2002: Johan Castberg, Wisting and Gotha results of 3D seismic and the geologists belief in the possibilities. 33 companies are cooperating on 4 broadband 3D seismic surveys for 23rd round. The truth is not determined by majority voting. Renewed interred due to oil success and large structures available.
Opening Address: The Barents Sea, A New Era
Wenche Tjelta Johansen, Head of G&G, Norwegian Petroleum Directorate
Exploration history of the Barents Sea
Undiscovered resources yet to find
Requirements for the Norwegian Continental Shelf and Barents Sea
Updates on the 23rd licensing round
78 fields in production, 60 in North Sea, 17 NCS, 1 in Barents; 13 fields being developed. Prolonging production requires enhanced recovery, opening new areas. 480 wells drilled on NCS (12 drilled 2005, lowest ever, has increased because of high prices, last year second highest exploration wells ever).
Key inputs to assessment: number of possible prospects, size distribution, probability of success, hydrocarbon phase. Statistical methods: calculated stochastically (Monte Carlo simulation), results for individual plays are aggregated to give a total quantity, presented as a probability distribution.
Creaming curve Barents Sea, based on 90 wildcat wells, last three years considerable resource growth. Optimism is back in the Barents sea and explorations wells highest in the last two years.
Barents Sea South East: NPD data aquired spring and summer for most prospective areas.Barents Sea North 2012-2014. Licensing rounds held every second year. 23rd Licensing round – January – 160 blocs nominated, 140 in the Barents Sea. 61 proposed blocks on public hearing.
Goliath production this year. Only one producing in Barents, Snovit, gas bearing. Unit costs can be reduced through cross licenses.
Q & A: How do you include in your yet to find, recent good news and bad news.
Yet to find, is updated every 2 years.
What percentage of wells drilled in the Barents are based on hydrocarbon indicators?
Where Do Real Opportunities Lie? Investment Conditions In The Northern And Southern Barents Sea
Haakon Haaland, Executive Vice President Business Development & Exploration, E.ON E&P
Distinguishing the key players and possible future players in the Barents Sea
Understanding the status of developments in the Southern and Northern Barents Sea
Evaluating the most recent Barents Sea discoveries
Venturing into the former grey zone
Political/Commercial aspects of industry. Mix between state/private is key to what will happen in the Barents going forward. Before continuing a few facts about E.ON E&P. Current focus areas, UK, Norway, Russia, Algeria and Brazil. 14 production fields, 5 producing fields as operator, 60 exploration licenses, staff of 220 employees and 200 contractors.
Crossing the 62 median line (not so much the “Barents Area”) — was the industry ready. No secret that the Barents was Gas, not a big prospect, always looking for oil. A decisive energetic ministry combined with competent NPD – creating the right policy of exploration. Barents initiative during the 1990s, wanting something to happen, and taking decisive action to encourage exploration. In terms of a global scene, it is a well organized efficient development process (data organized and released timely, modestly costed). Goliat, Goliate-Kobbe, Johan Castberg – drilling boom.
Barent Players – Statoil still major player in Barents Sea exploration; Majors not active anymore: Exxon, Shell – Companies left the area: Mobil, Saga, Hydro; New important entrants: ENOI, Lundin, OMV Other newcomers: DF, DONG, Noreco, Repsol.
ENI, Statoil, Lundin, continues to have stamina. Barents: After more than 30 years still a frontier area. Not the North Sea, Key discoveries (Snohvit, Castberg, Havis, Goliat) conventional exploration models; Late Neogene uplift and erosion, huge area, limited data; South Barents south east total frontier zone.
Cost levels, lack of infrastructure, and too much bad news at the same time. Gas discoveries create dry spells in continued exploration. One clear risk/opportunity: Norway will reach production maturity in mid 2020s, need for new gas that will utilized this infrastructure, especially liquid gas. Connecting Barents with the Norwegian infrastructure system. Infrastructure key to value creation. In the past, private investors always had interest in constructing infrastructure, in the North sea, large anchor fields created an interest. Today, commercial entities not interested in investing 5-6% returns on pipelines to create the infrastructure required to move forward on Barents. One of the difficulties in Norway, is that politics is difficult to step out in front of projects, to be a front runner on investments, there is the debate on social distribution. Debate over whether the State and Ministry step up to create the infrastructure to unleash activity and value creation from Barents area. Another discussion on special incentives such as Snohvit, special production allowances.
Q&A How decisions can be made with several degrees of uncertainty: Priorities, driven by the ambition to replenish – but there are forces against (cash flow, investor sentiments — the most moving audience of all, because if you fail to deliver on the quarterly the CEO gets fired).
Unique cost drivers in Norway, nothing to be proud of, operating drilling more expensive than anywhere else, a need to get productivity up, no way it should take 50 percent more time to an engineering design for a semi than required. Mobilize as an industry.
To early to have the discussion about how to connect the Barents. Looking to have more exploration before any kind of determination can take place.
Keynote Session:
Will Commercial Success Follow Exploration Success In The Barents Sea?
Terje Flaten, 23R Project Manager, Statoil
Statoil’s approach to Barents Sea exploration from play validation to exploration focus
Barents Sea Southeast 3D seismic cooperation project
Development challenges and commercial hurdles
Will commercial success follow exploration success. Myths or Facts: Developing Barents Sea discoveries commercially requires — much bigger discoveries than anywhere elsewhere; massive development of new technologies; completely different methods for oi spill handling; new solutions for escape, evacuation and rescue, management of ice totally unique.
First oil production will be at Goliat. Exploration conventional seismic and mapping early discoveries. Periodic and underexplored
Steps to commercial success in the NCS/BS — (1) Big discoveries (high resolution seismic acquisition solution; triassic reservoir presence and quality): How big is big — 150-300 million barrels represents the threshold; key issues is how to build out hubs and field centers. (2)Political acceptance and license to operate: Trust, transparency (distance and temperature, people in extreme cold; robust oil spill contingency – barriers to recover spilled oil and barriers in the well to prevent oil spill) (3) new technology: Horizontal drilling in shallow reservoirs (time and cost, overburden stability, happening in Hoop, Bjarmeland, BSSE); handling of produced water (clean water discharge, everywhere); new sub-sea solutions (incremental development needed. Away from North Sea Standards where they are not needed) (4)industry cost level: Positive oil price development – however more expensive reserves erode returns. Cost per barrel increasing. Restoring the returns: Standard solutions adapted to sub-surface and surface conditions: drilling costs and efficiency, leaner facility concepts, replicated and standard packages, wider industry co-operation, reuse. Last decade – oil price tripled, development costs doubled.
Cooperation: BSSE 3D Group Shoot: Authority guidance;encouragement, attractive business model, equal and low costs (no volume disc out, fair price differentiation between EP and LP, room for different company strategies and prioritization); Involvement in decision making and survey design.
“Business Card Exchange”
“Take advantage of this networking opportunity to introduce yourself and exchange business cards with other conference delegates. Start with the people closest to you and then move around the room to learn more about other attendees and their companies and projects.”
The Role of Structural Geology In Success-Failure Analysis – Examples From the Barents Sea
David Jackson, Global Manager Multi-Client New Ventures, Dolphin Geophysical
Understanding the present day architecture of the petroleum system
How has the petroleum system developed through time
Understanding the role of key tectonic events in changing the petroleum system
The communication of geological understanding and rationale to non-geologists
Understanding the Barents Sea’s Unique Petroleum System: Source Rocks
Tommy Samuelsberg, Exploration Manager Barents Sea, North Energy
Understanding the unique petroleum system in the Barents Sea
Exploring which source rocks exist in the Barents Sea
Underlining the quality and nature of source rocks in the Barents Sea
Play models in the Barents Sea
Exploration history of South-Western Barents Sea; Play models in the Barents Sea (Permian, Triassic, Jurassic, Late Cretaceous/Paleocene); Petroleum systems. First discoveries 1981 (Alke South, askeladden); Albatross (1982) and Snøhvit (1984) – 8th rounds..
Networking lunch break
Ice, Erosion and Broken Plates: Unravelling the Tectonothermal Effects on the Barents Sea’s Petroleum System
Ebbe Hartz, Chief Geologist, Det Norske
Late Cenozoic uplift and erosion in Barents Sea’s petroleum models
The geodynamic challenges of deposition, uplift and erosion of the assumed overburden
The different petroleum models that result from reducing erosion estimates by considering the effect of glaciation and continental break-up. Hans introduces Ebbe as a ski champion – “I will speak without using the microphone, and will do so until they fix the computer [PPT – there was some issues with PPT earlier on during the day]…. using Heriksen and friends from Statoil’s Slides to make the presentation.
Ice probably caused significant compaction, thus erosion estimate stop high; Paleo heat suggest less erosion, and may partially have come from break up. Break up hear probably uplifted Svalbard, erosion enhanced this process; Thus, implementing ice loading highly effects petroleum models for the Barents Sea.
Unleashing the Untapped Potential: Reserve Estimates for the Barents Sea
David Poole, VP Exploration & Deputy CEO, Spike Exploration
How can we use resource estimates as a predictive tool in the Barents Sea?
What are the lessons learnt from more mature areas on the Norwegian Continental Shelf and how can these be applied in the Barents Sea?
Applying resource estimations to future strategies and ensuring return on investment, from a Spike perspective
“Back to strategy” – Focus on using historical data in mature basins as predictive tools in the Barents Sea; Analyses of historic exploration performance in UK and Norway used to highlight trends in exploration and yet to find for the different basins; Sources of information includes: exploration wells and NPD.
Early entrance action.
[ed. space of humor- geologist sparring with statistician]
Where Does The Technology Gap Begin In The Barents Sea?
Stig-Morten Knutsen, Head, Roald Amundsen Petroleum Research
Addressing the unknowns of the subsurface and the surface
Knowing how to detect and handle ice
Overcoming environmental and technological risk and uncertainty
What’s with the Barents Sea”
Circum-Arctic setting
Challenges
Data and subsurface
Technology: The application of scientific knowledge for practical purposes especially in industry. Five Norwegian Partners in Roald Amundsen: U Tromsø, U Stavanger, IRIS, Norut, Akvaplan-niva.
Proven plus probable discovered Arctic resources (2P) – Barents – A far north area without some of the extreme far north issues. Barents: as a step stone to the circum Arctic (offshore).
Subsea challenges – Temperature. Hydrates and flow assurance. Topside challenges (drilling rigs are more expensive due to winterization features).
Seismic affect on mammals in Greenland – Big discussion when you get to ice affected waters how marine mammals are affected by seismic acquisition AND who oil spill will be looked at; emergency evacuation.
Contemporary 3rd and 4th wave of Barents development having to do with knowledge and information. First wave, Snøvit; Second wave during the 1990s up to 2000 discovery of Goliath.
Referring to Nansen — sometimes the model is important, sometimes the data is important.
Roundtable Discussions
Moderated roundtable discussions to allow in depth discussion and debate around a variety of topics. Delegates will choose one roundtable and use this opportunity to ask questions and discuss the key exploration challenges of operating in the Barents Sea.
1. Exploring for gas and the lack of infrastructure in the Barents Sea. A catch 22?
Led By: David Poole, VP Exploration & Deputy CEO, Spike Exploration
2. What are the key technological obstacles the industry needs to overcome to make developments in the Barents Sea?
Led By: Stig-Morten Knutsen, Head, Roald Amundsen Petroleum Research
3. How does exploration in the Barents Sea differ to exploration in other regions?
Led By: Denis Francois, Director Geosciences, TOTAL
Closing Remarks from the Chair
Close of Conference Day One and Networking Drinks
Read Full Post »